

Frontleaf & New Relic Boost Customer Success Analytics
Like many software companies, when we built our application here at Frontleaf, we instrumented it with New Relic. We did so because we thought it was the simplest, most cost-effective way to monitor performance and reliability. Within minutes of deploying it to our production environment, we were collecting a wealth of information that has helped us pinpoint errors, tune queries, optimize code, and refine our system architecture.
From the beginning, it occurred to us that the data collected by New Relic could be useful for much more than just performance monitoring. With the right processing, information about requests, transactions, and queries could be transformed into patterns of customer usage. And those usage insights could help determine customer health and identify which customers pose a serious churn risk. New Relic could become a platform for Customer Success Analytics. Frontleaf could help make this a reality.
The question is how to make that happen?
The addition of New Relic Insights is the key. For New Relic users, raw data about all of your Web transactions already flows automatically into Insights, where you can query and visualize the data and export it for deeper analysis. The trick is applying a complete strategy for transforming your New Relic Web transactions into meaningful customer insights.
Here is how we did it:
Types of Customer Usage Data
Before getting to the strategy itself, let’s briefly review the two types of usage data that are particularly important for understanding customer outcomes:
Direct user interactions. It is often possible to distinguish between renewing and cancelling customers by measuring differences in direct interactive usage. Sometimes the relationship is highly intuitive (renewing customers log in more often, enter more data, and use more advanced features) and sometimes it is not (cancelling customers might use a particular feature such as search more often, perhaps indicating that they are failing to accomplish some common task).
The most common strategy for collecting interaction data is to report events from the client, via a JavaScript “tracking beacon” for HTML interfaces or a native SDK for mobile applications. Many “Web analytics” services make it easy to get started with client-side instrumentation. However, it usually requires ongoing developer attention to add and maintain the instrumentation code.
Performance metrics. Direct user interaction with an application is usually just a means to an end; users don’t necessarily want to interact with the application unless they need to. What often matters most to customers is what an application does without intervention, whether that is displaying Web pages, collecting form submissions, processing payments, or anything else. Performance metrics about these types of activities are often excellent proxies for the perceived customer value of an application.
The best source of performance metrics is usually either a production database or an internal data warehouse. Here too, the initial effort to write a few queries may be low, but it can require ongoing developer or operations effort to maintain proper access over time.
Turning New Relic Web Transactions into Usage Data
This helps explain why organizations often wind up pursuing two completely different implementation strategies for collecting interactive usage data and performance metrics. Developers, operations engineers, and data analysts are often on the hook both for deploying the initial code changes as well as maintaining them over time. Although it’s often overlooked, the maintenance requirements can grow to overshadow the initial work and become a barrier to adopting a data-driven customer success strategy.
The combination of New Relic APM and New Relic Insights provides an enticing alternative. Rather than requiring two new, completely distinct implementation projects, it builds on the New Relic instrumentation that you already have in place.
Let’s start with the data you already have, assuming you have deployed New Relic to production and are using a standard Web application framework. For example, let’s use an invoicing application that lets customers create and send invoices to other people, who can then view and pay the invoice. (For the screenshots, we created a simple app using Python and the Flask micro framework. Exactly what you see will vary depending on your framework and application.)
Let’s go to New Relic Insights and look at the names of recent transactions:
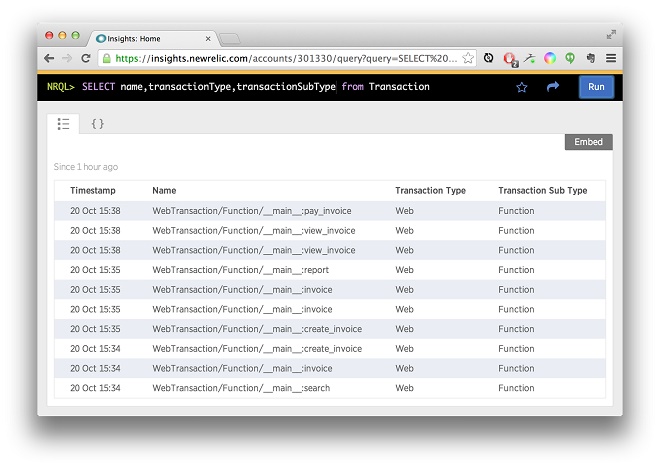
Each “Web transaction” corresponds to a server request, which occurs each time a client loads a page or makes an API call. For most Web and mobile applications these days, the bulk of server requests are API calls triggered by user actions (clicking a button or link, submitting a form, dragging and dropping, making a touch gesture, etc.). Depending on the nature of your application, you may lose some detail by tracking direct user actions only through the lens of these server-side requests, but with the significant advantage of not having to instrument your client interface (or in many cases, multiple client interfaces.)
Conveniently, New Relic also records background tasks—such as sending an email, processing an image or document, or settling a payment transaction—in the same event stream as Web transactions. In aggregate, these tasks can be an important source for performance metrics that reflect value to the customer.
By default, the Python agent (and with some variation, other New Relic agents) names Web transactions by the function that handled them. These raw names don’t always map to meaningful customer actions, but the agent makes it easy to assign meaningful names to transactions:
newrelic.agent.set_transaction_name("Pay Invoice", group="Payer")
Before you go wild sprinkling these statements through your code base, however, remember this golden rule:
Instrumentation for customer data is most useful when it is consistent across application features and over time.
When you start naming transactions, you are implicitly defining a taxonomy of customer actions that informs downstream analysis. Some types of “black box” models may not require this kind of structure, but it is necessary if you want to glean insights that have an intuitive connection to the source data.
So before you start coding, it’s worth documenting this taxonomy independently of how the application is currently implemented. Identify a limited set of abstract actions and performance metrics that best reflect both the hard value and emotional satisfaction that users get from your application.
Once you have documented an abstract taxonomy, you can start naming transactions accordingly, using conventions that help enforce consistency and completeness over time. Try to encapsulate transaction naming as a “separate concern” from the main logic of your request handlers, using whatever means are available in your framework of choice.
Once you’ve added transaction names to at least some request handlers, the data in Insights starts to look much more interesting:
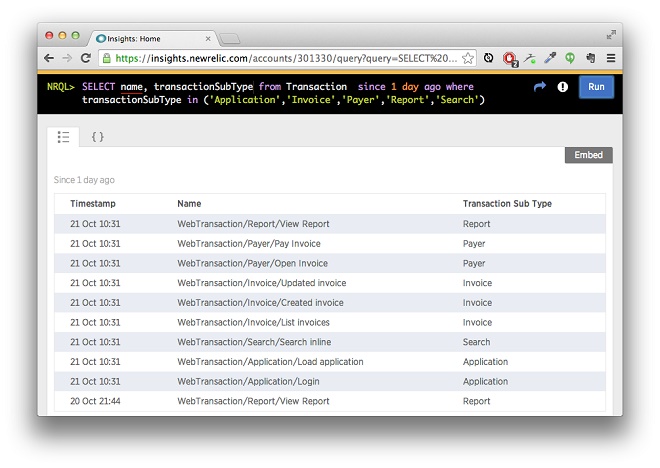
In our example, we grouped interesting transactions in a few major clusters by feature area, and used them to filter out unnamed transactions in Insights. As we’ll see below, you can use custom parameters to group named transactions in multiple ways for subsequent analysis.
Identifying Accounts and Users
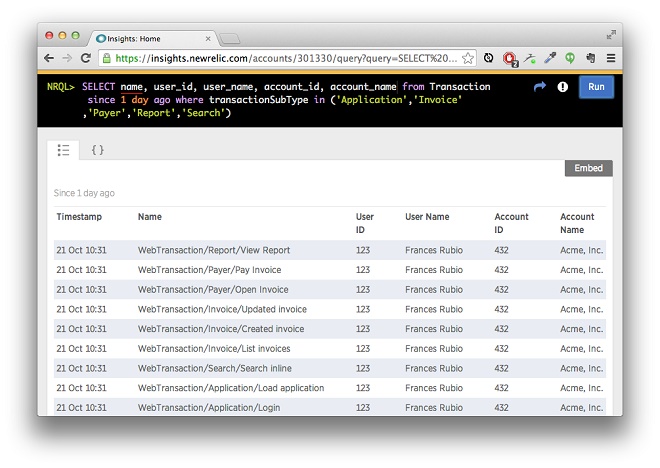
The transactions look nicer this way, but customer data isn’t complete without actual customers. Every transaction needs to be associated with an “account” representing the user or organization that pays the bill. For multi-user applications, direct interactions should also be labeled by user.
Adding account and user attributes to every Web transaction is relatively easy; just look at the currently authenticated user and set some “custom_parameters”:
newrelic.agent.add_custom_parameter("account_id", "432")

newrelic.agent.add_custom_parameter("account_name", "Acme, Inc.")

newrelic.agent.add_custom_parameter("user_id", "123")

newrelic.agent.add_custom_parameter("user_name", "Frances Rubio")
Once you have done that, the identifiers simply show up as additional queryable parameters in New Relic Insights:
Note that named background tasks should always be associated with an account, but not always with an individual user. Even if it’s just at the account level, background tasks still often provide useful raw data for performance metrics.
For downstream analysis, what really matters are the ID parameters; the names are there primarily for debugging. The ideal account and user IDs should be permanent, unique, and ubiquitous to help you unambiguously aggregate and link transactions with data from other customer systems, such as CRM, help desk, financials, and messaging.
Unfortunately, many companies don’t have perfect “master keys.” Internal systems often evolve organically over time, not always in complete lockstep with each other. Third-party tools get added and accumulate separate silos of data. Developers and data analysts get swamped with urgent customer and business demands and seldom have time to address this kind of “data quality debt.”
You don’t need to address all these issues as part of enhancing your New Relic instrumentation. But it helps to at least think about them, and try to leave some options open for downstream matching. For example, perhaps you can give every account a unique subdomain or short code in addition to an integer primary key.
Adding Transaction Parameters
This approach should help make your New Relic transaction data a good source of data for both direct user interaction as well as performance metrics, which together can support insights into customer engagement and outcomes.
One final enhancement is to add customer parameters that help to quantify or qualify the impact of each key transaction. In our example, two obvious candidates would be the total amount and number of line items in each invoice:
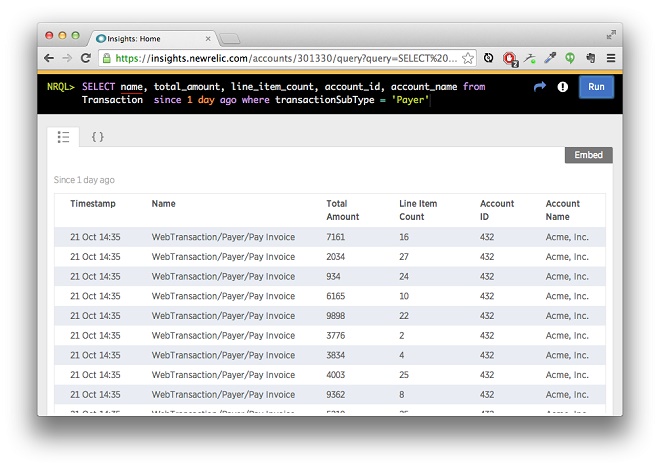
Note that these parameter values are specific to each transaction. If they are available you could also add user- and account-level parameters, such as subscription plan or user role, which may be useful for aggregate analysis.
Exploratory Analysis and Dashboard Creation
New Relic Insights can deliver a rich stream of meaningful customer data for modelling risks and opportunities in your customer base. It’s critical to remember, however, that the principle of “Garbage In, Garbage Out” still applies. If the source data has gaps or inconsistencies in the naming of transactions, labeling of accounts and users, or setting of custom parameters, then it will be difficult to detect significant patterns in the data.
The New Relic Query Language (NRQL) built into New Relic Insights provides a rich set of filtering and aggregation features that can help you understand and verify your customer data. Even better, you can quickly inspect query results in both tabular and graphical form. Here are a few suggestions:
- Use a
TIMESERIESto review the daily count of key transactions for key accounts. If possible, check it against production data and make sure it looks correct. - Use
countUnique()to check the number of accounts that report data on each day. Check that it matches your rough expectations for the overall number of active accounts. - Use
count()with FACET to inspect the total number of transactions by name. Ensure that all expected transactions are being reported, and that the counts seem roughly aligned (e.g. you don’t see 1,000,000 logins but only 10 invoices created). - Use
histogram()to look at the distribution of values for custom parameters such as invoice amount. Are you receiving the number of values that you expected, and do they look like they’re in the right range?
Besides verifying the data and laying the groundwork for customer success analytics, these types of queries can also be the basis for dashboards that provide useful feedback to a variety of teams within your company. The sales team may be keen to track the activity of trial accounts, while the product group may want to look for changes in customer adoption of a specific feature after a release.
Predictive Modelling
The combination of New Relic APM and Insights provides companies with a compelling alternative for obtaining customer usage data that leverages the instrumentation you already have. This post has shared a complete strategy for transforming your raw Web transactions and background tasks into customer usage data that your entire organization can use.
If your ultimate goal is to assess customer retention risk, however, there is one more phase in the strategy, which is to build a predictive modelling pipeline:
- Use the New Relic Insights Query API to query interactive usage and performance metrics by account.
- Match up the data from New Relic with other sources of customer data such as CRM, support, messaging, and financials.
- Transform the data to generate a set of “features” (numeric or categorical values) that can be fed into a model.
- Run the model and predict risk for each account.
- Use the risk assessment to segment customers and drive customer success programs.
- Periodically validate the model’s accuracy and update (or retrain) as necessary
Customer success platforms such as Frontleaf aim to simplify the implementation and maintenance of these pipelines. Together with New Relic, they can provide you with a robust solution for customer success analytics.
Thank you to New Relic, who originally posted this article as a guest post on their blog.
- Like this post?
Subscribe by email
